
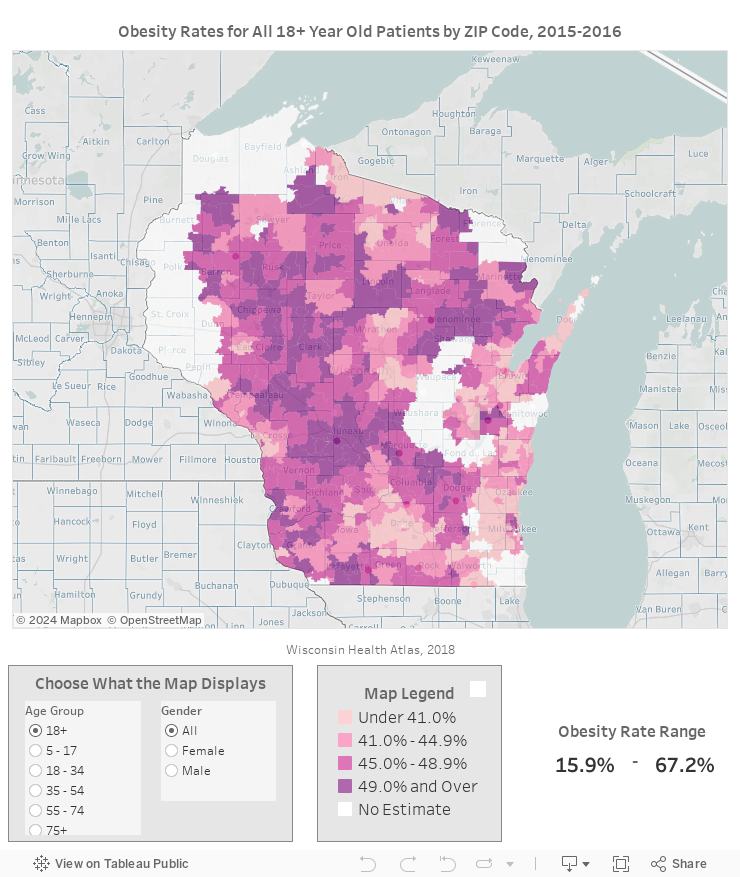
Obesity varies by ZIP Code. Place matters.
Where you live has a big impact on your opportunities to maintain a healthy weight. People living in ZIP Codes throughout Wisconsin have very different rates of obesity. Adult obesity rates ranged from 15.9% to 67.2% statewide. That means the ZIP Codes with the highest rates of adult obesity have rates over 4 times as high as ZIP Codes with the lowest rates.
Differences by place are even more striking among children. Childhood obesity rates ranged from 5.8% to 38.5%. That’s about six times as high in ZIP Codes with the highest obesity rates compared to those with the lowest.
Obesity Map
Use the interactive map below to explore obesity rates by ZIP Code.
Use the radio buttons to change the age group and gender displayed on the map.
Scroll down for map tool help and instructions.
+ Click here for more map help
- Hover over the map to view map controls in the top left
- Hover over a ZIP Code to view more information.
- Hold shift, click, and drag to pan map.
Healthy Weight for all Places
Differences by Place
Obesity rates vary both across the state and within communities. Neighborhood conditions play a big part in maintaining a healthy weight. Some neighborhoods in Wisconsin have great options for healthy, active living, like easily accessible parks and recreation opportunities and places to buy or grow fruits, vegetables, and other healthy foods. Other neighborhoods have few transportation and housing options, a lack of job opportunities, few or no places to buy affordable, healthy food, and few safe places to be physically active. In these places, Wisconsinites have fewer options and less opportunity to engage in healthy behaviors.
Residential segregation and other forms of structural racism have contributed to creating differences in opportunities to be healthy.1–3 Addressing these unfair systems, policies, and practices is crucial in closing the gaps in obesity rates that we see within Wisconsin.4 Strategies that focus only on reducing the obesity rate overall without addressing differences between places and groups have the potential to increase those differences.5 Everyone has a role to play in shaping opportunities for good health. And lifting up the voices of those most affected by poor health can often lead to meaningful change.
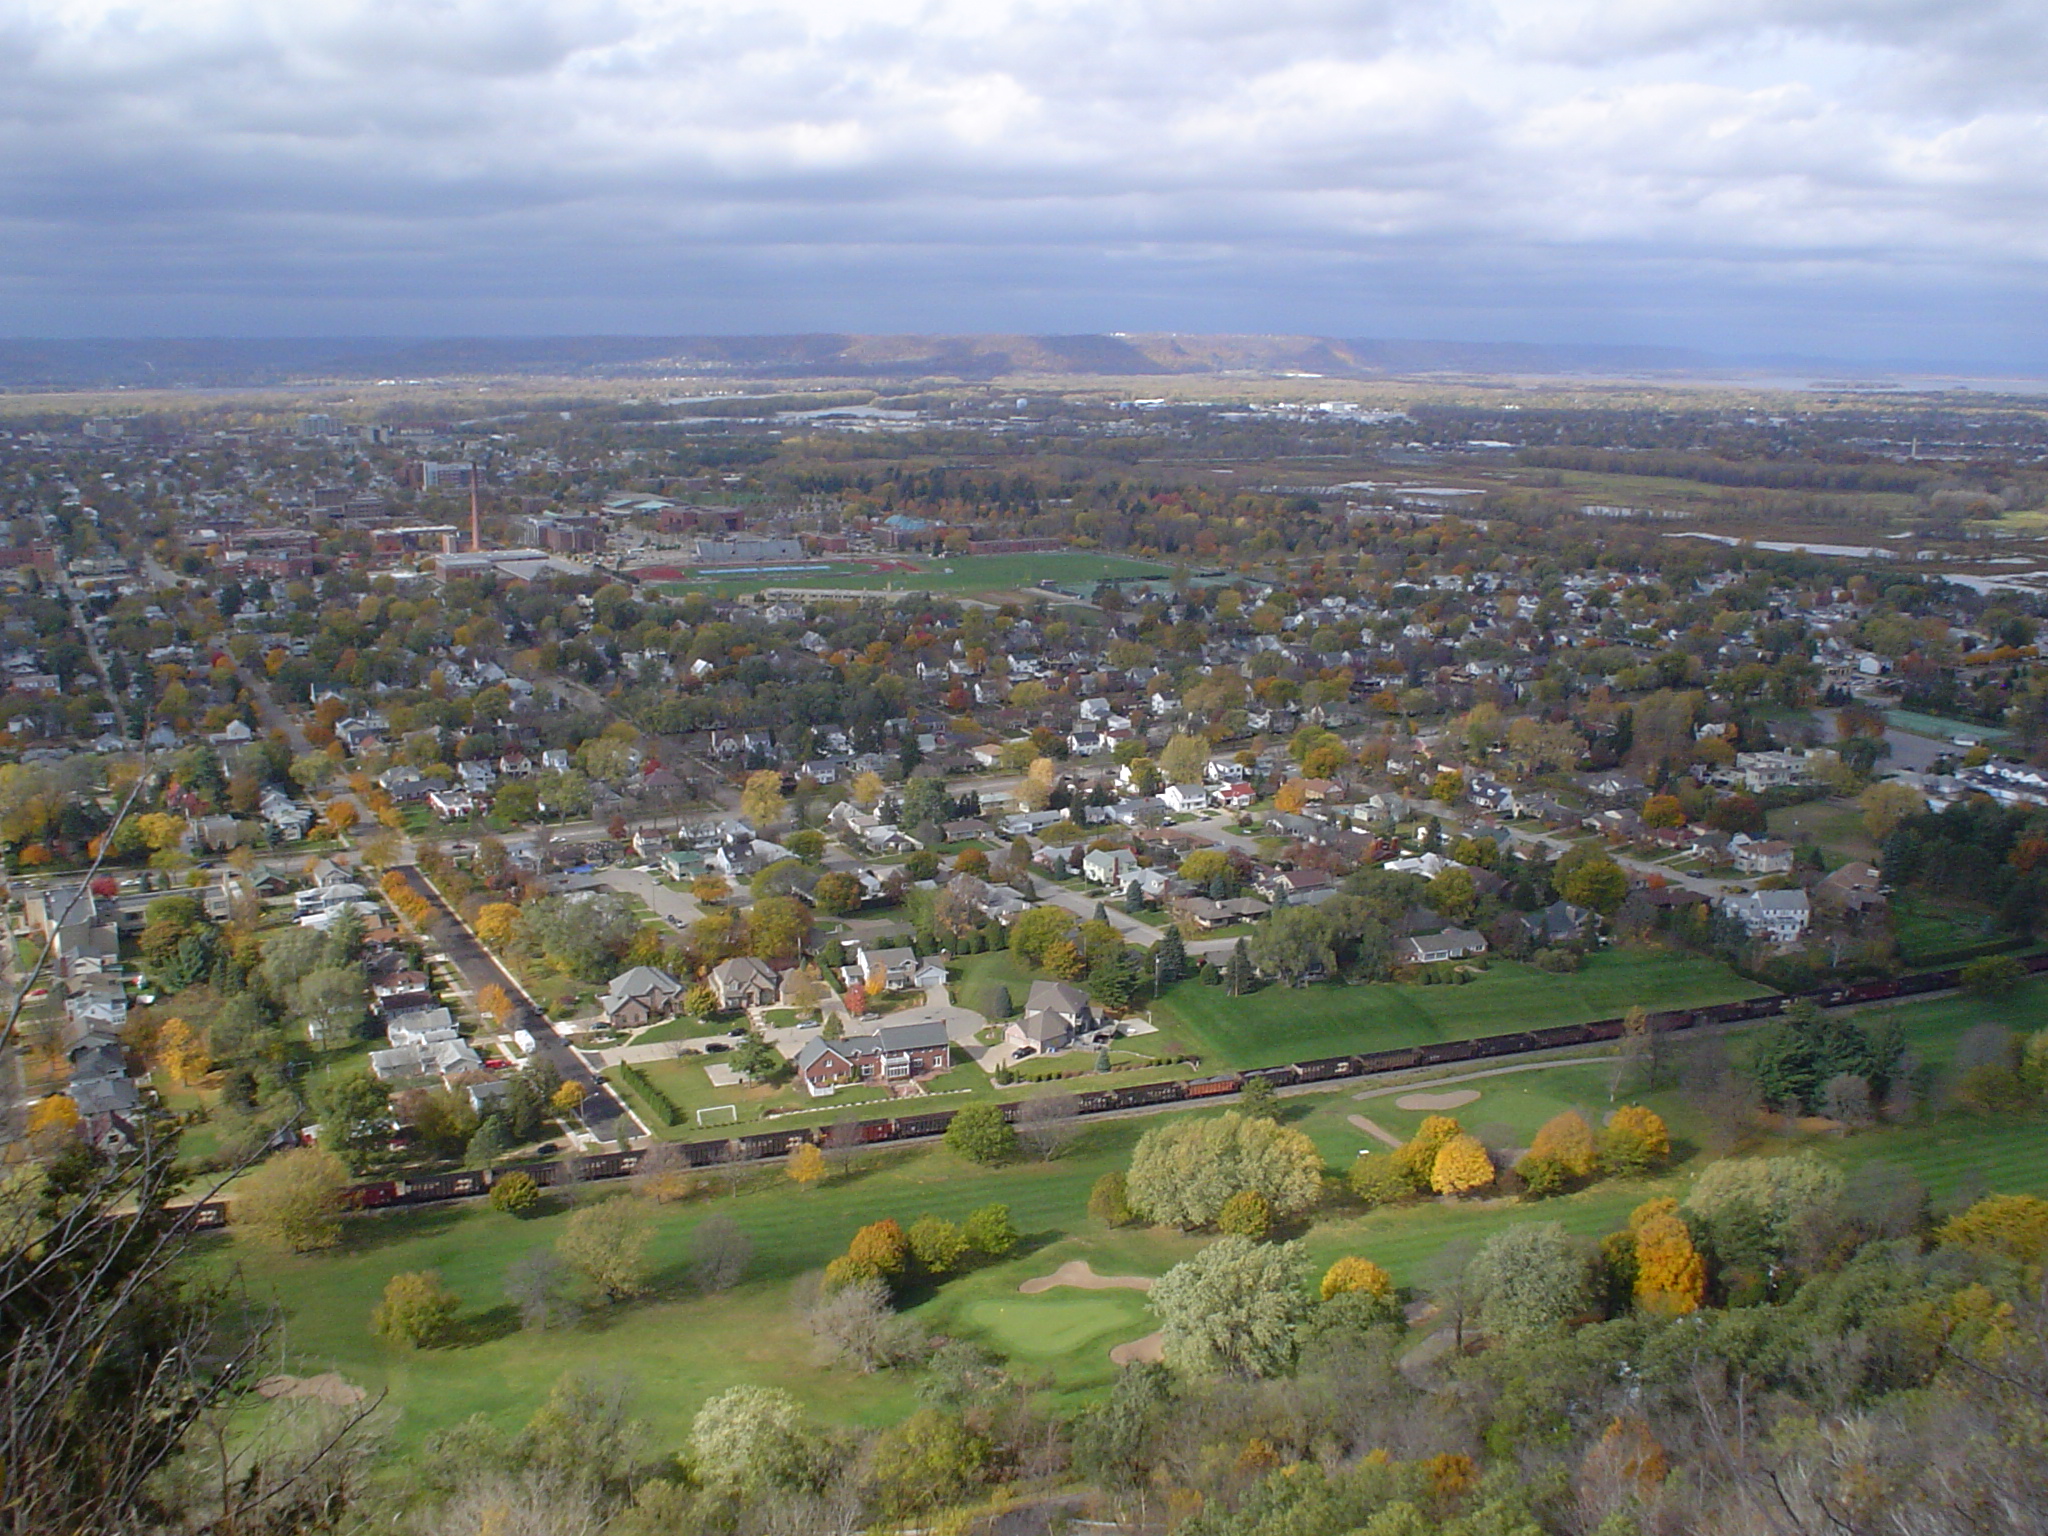
Rural Places


On average, rural communities have higher rates of obesity than urban areas.6,7 Some of this difference is because rural residents tend to be older, have less education, and have less access to health care, factors that we know are associated with higher obesity rates.8
Beyond these population differences, rural environments themselves present unique barriers to healthy eating and physical activity. But rural communities also have unique strengths for preventing obesity (see below).9 Strategies for promoting healthy eating and physical activity that make sense in urban or suburban areas don’t always work in rural places. Rural residents need unique obesity prevention strategies that capitalize on their strengths and address their challenges. Strategies that focus on creating healthy rural environments have the potential to improve rural health and shrink the urban-rural differences in obesity rates.
Rural Challenges
Longer travel times
Few facilities for physical activity
Limited healthy food options
Lack of alternative transportation options
Safety concerns related to isolation
Rural Strengths
A school or community building can provide an activity hub for active living programs and policies
Pleasant places to walk and bike
Community leaders play many roles, which can facilitate cross-sector collaboration
People know each other and their community leaders
For more information on planning for health in rural areas, check out our Healthy Rural Community Design Scorecard.
Urban Places
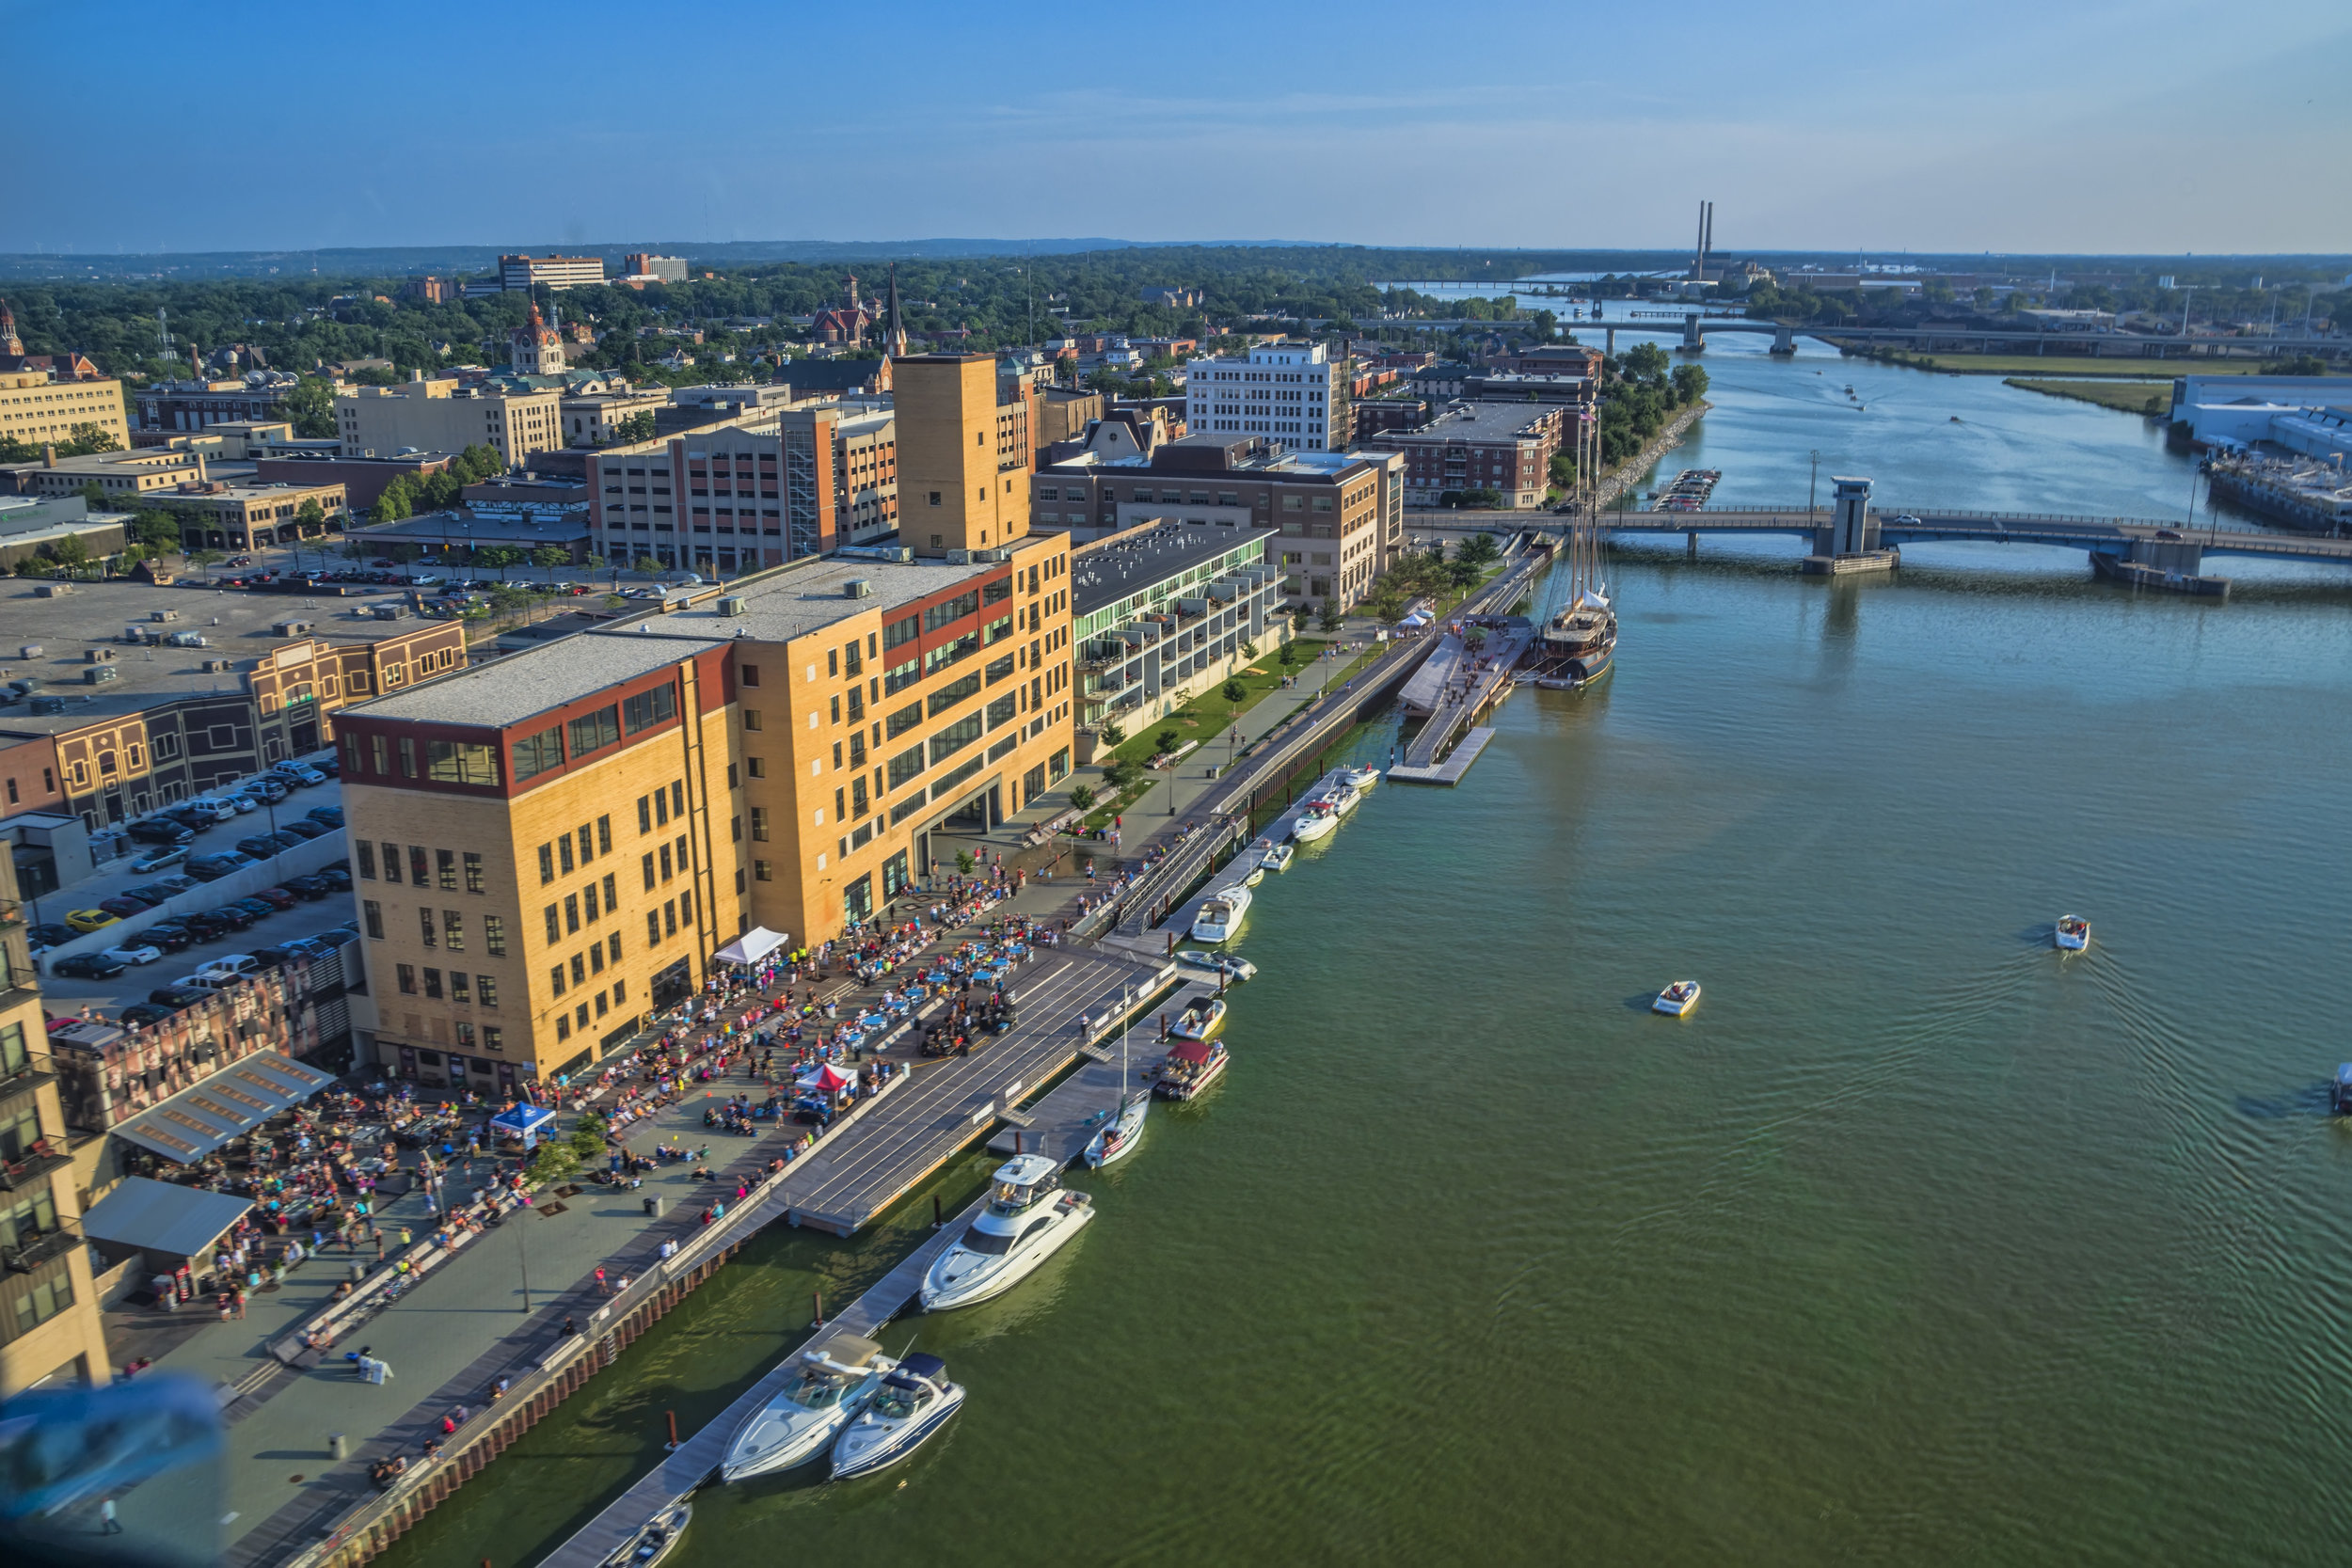
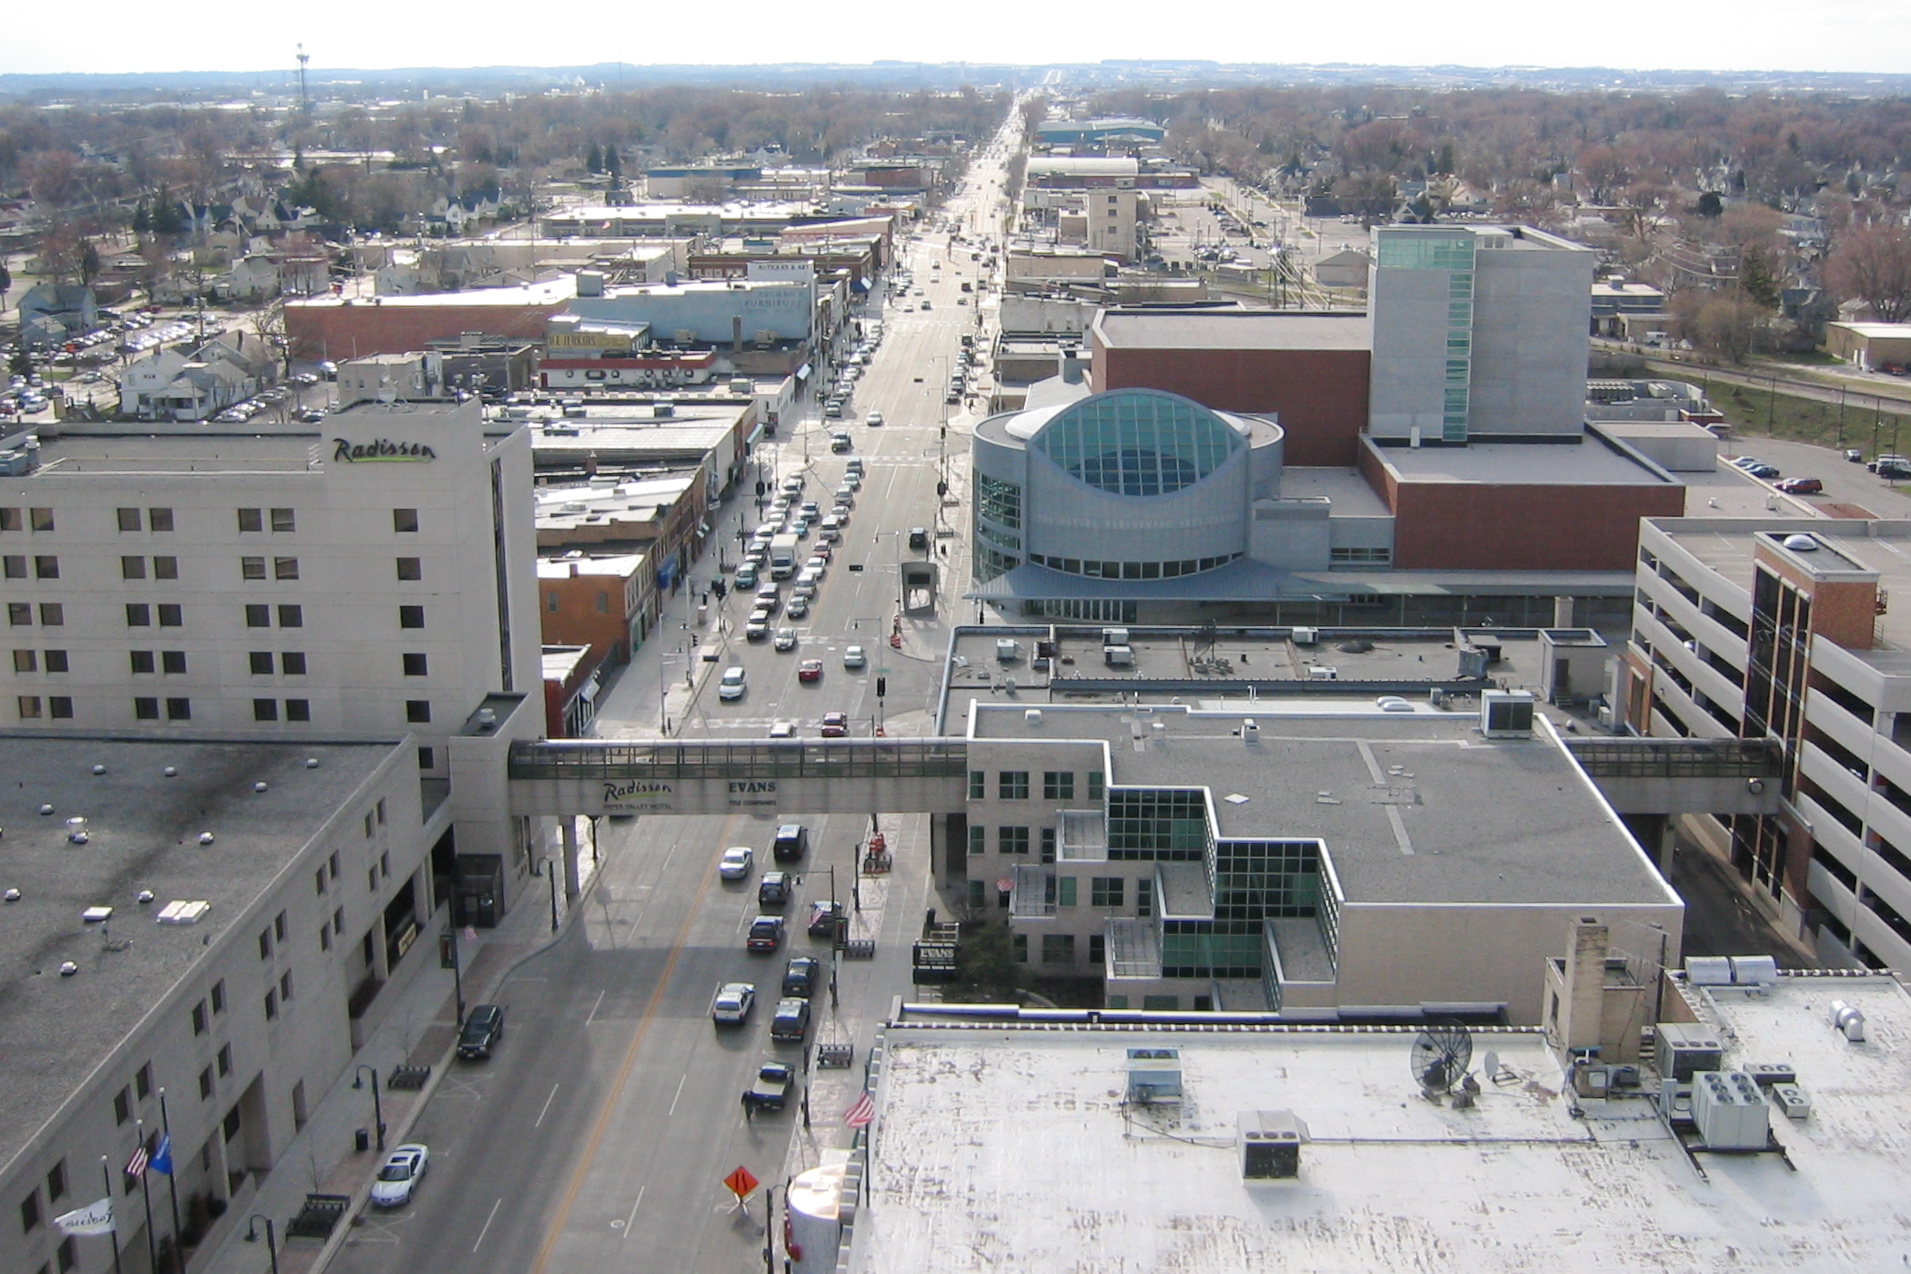


While urban areas have lower obesity rates than rural areas overall, there are big differences in obesity prevalence within cities. Milwaukee and Madison have some of the ZIP Codes with the lowest obesity rates statewide. However, neighboring ZIP Codes can have obesity rates twice as high.
Overall, urban environments tend to have more features that make it easier to stay physically active and eat a healthy diet compared to rural areas. They have a higher population density and residents tend to have better access to key facilities, such as grocery stores and parks.9 However, not all urban residents have the same access to these health-promoting benefits. Differences between neighborhoods in the physical environment,10,11 food environment,12 community safety,13 poverty,1,14-16 employment,17 education,15 and income18 help explain differences in healthy behaviors and obesity rates.4
Strategies that work to reduce obesity in urban areas have the potential to reduce the differences we see in obesity rates within neighborhoods. Engaging residents of places that have higher rates of obesity can help to create urban environments that give everyone a fair chance to be healthy.
References
Kwarteng JL, Schulz AJ, Mentz GB, Israel BA, Perkins DW. Independent Effects of Neighborhood Poverty and Psychosocial Stress on Obesity Over Time. J Urban Heal. 2017;94(6):791-802. doi:10.1007/s11524-017-0193-7.
Bailey ZD, Krieger N, Agénor M, Graves J, Linos N, Bassett MT. Structural racism and health inequities in the USA: evidence and interventions. Lancet. 2017;389(10077):1453-1463. doi:10.1016/S0140-6736(17)30569-X.
University of Wisconsin Population Health Institute. County Health Rankings 2018.
Allen C, Ammerman A, Arline S, Brown D, Macgowan C, Mccarthy W. Health Equity Resource Toolkit for State Practitioners Addressing Obesity Disparities. :1-84. http://www.cdc.gov/obesity/downloads/CDCHealthEquityObesityToolkit508.pdf.
Frederick CB, Snellman K, Putnam RD. Increasing socioeconomic disparities in adolescent obesity. Proc Natl Acad Sci. 2014;111(4):1338-1342. doi:10.1073/pnas.1321355110.
Johnson JA, Johnson AM. Urban-Rural Differences in Childhood and Adolescent Obesity in the United States: A Systematic Review and Meta-Analysis. Child Obes. 2015;11(3):233-241. doi:10.1089/chi.2014.0085.
Befort CA, Nazir N, Perri MG. Prevalence of Obesity Among Adults From Rural and Urban Areas of the United States: Findings From NHANES (2005-2008). J Rural Heal. 2012;28(4):392-397. doi:10.1111/j.1748-0361.2012.00411.x.
Rockeymoore M, Moscetti C, Fountain A. Rural childhood obesity prevention toolkit. 2014;(October).
Hansen AY., Umstattd Meyer MR, Lenardson JD, Hartley D. Built Environments and Active Living in Rural and Remote Areas: a Review of the Literature. Curr Obes Rep. 2015;4(4):484-493. doi:10.1007/s13679-015-0180-9.
Mujahid MS, Roux AVD, Shen M, et al. Relation between neighborhood environments and obesity in the multi-ethnic study of atherosclerosis. Am J Epidemiol. 2008;167(11):1349-1357. doi:10.1093/aje/kwn047.
Gordon-Larsen P. Inequality in the Built Environment Underlies Key Health Disparities in Physical Activity and Obesity. Pediatrics. 2006;117(2):417-424. doi:10.1542/peds.2005-0058.
Martinez-Donate A, Valdivia Espino J, Meinen A, Escaron A, Roubal A, Nieto F. Neighborhood disparities in the restaurant food environment. Wis Med J. 2016;115(5):251-258. https://www.wisconsinmedicalsociety.org/_WMS/publications/wmj/pdf/115/5/251.pdf%0Ahttp://ovidsp.ovid.com/ovidweb.cgi?T=JS&PAGE=reference&D=emed18&NEWS=N&AN=613554286.
Rees-Punia E, Hathaway ED, Gay JL. Crime, perceived safety, and physical activity: A meta-analysis. Prev Med (Baltim). 2017;111(June 2017):307-313. doi:10.1016/j.ypmed.2017.11.017.
Sheehan CM, Cantu PA, Powers DA, Margerison-Zilko CE, Cubbin C. Long-term neighborhood poverty trajectories and obesity in a sample of California mothers. Heal Place. 2017;46(April):49-57. doi:10.1016/j.healthplace.2017.04.010.
Kimbro RT, Denney JT. Neighborhood context and racial/ethnic differences in young children’s obesity: Structural barriers to interventions. Soc Sci Med. 2013;95:97-105. doi:10.1016/j.socscimed.2012.09.032.
Lippert AM, Evans CR, Razak F, Subramanian S V. Associations of continuity and change in early neighborhood poverty with adult cardiometabolic biomarkers in the United States: Results from the national longitudinal study of adolescent to adult health, 1995-2008. Am J Epidemiol. 2017;185(9):765-776. doi:10.1093/aje/kww206.
Naimi AI, Paquet C, Gauvin L, Daniel M. Associations between area-level unemployment, body mass index, and risk factors for cardiovascular disease in an urban area. Int J Environ Res Public Health. 2009;6(12):3082-3096. doi:10.3390/ijerph6123082.
Bowser J, Martinez-Donate AP, Carrel A, Allen DB, Paul Moberg D. Disparities in fitness and physical activity among children. Wis Med J. 2016;115(5):245-251. https://www.ncbi.nlm.nih.gov/pubmed/29095586.